Introduction
The following datasets were shared by research groups operating the IceRadar system in various part of the world using the system on a broad range of ice conditions. Unless specified otherwise all data were acquired using a Nugen Narod Transmitter, the IceRadar EPU, and resistively loaded dipoles antennas. Some data were acquired by skis, foot, and snow machine.
Left vertical axis is two-way travel time (s), right axis is depth (m). Horizontal axis is sample number not geospationaly resampled.
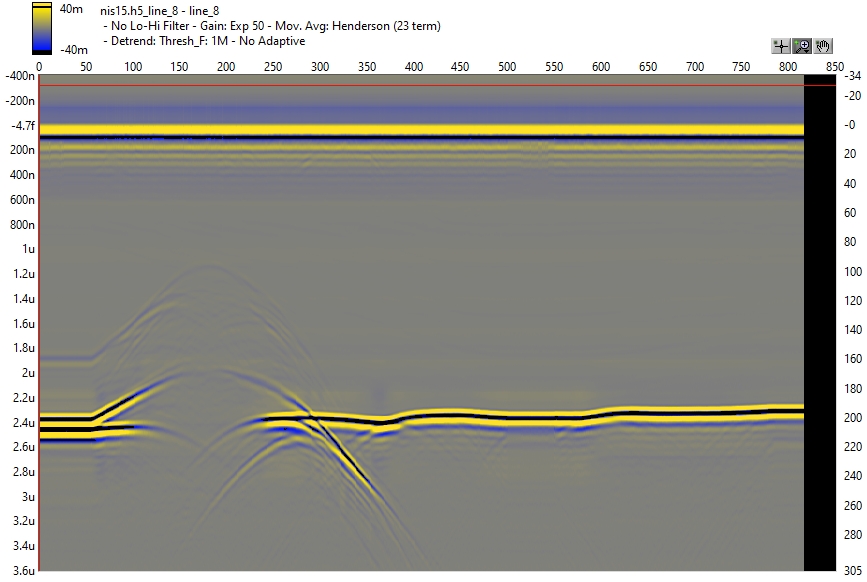
Ice-Shelves, Antartica
Nansen ice-shelf . Cold ice, no obvious englacial scattering. A "clean" radargram. 20 MHz center frequency antennas. Credit: WIRL
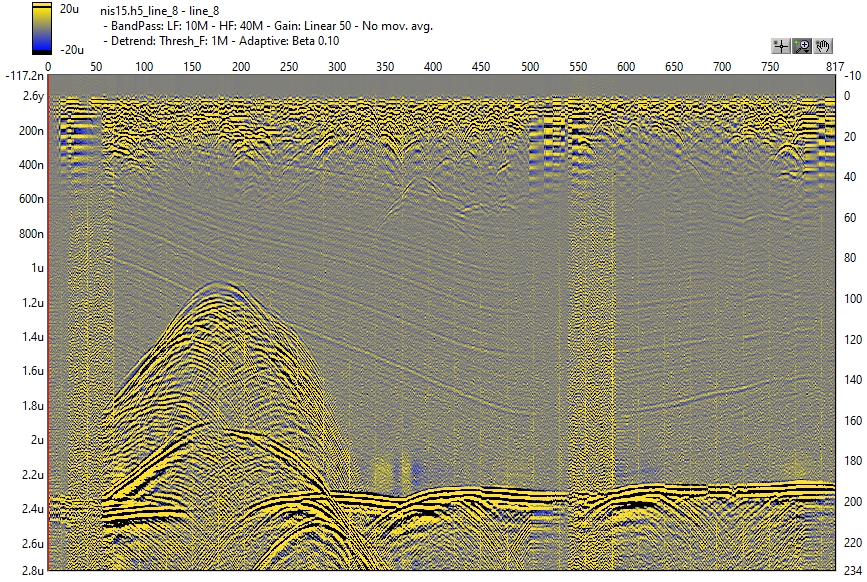
The same data set with different filter settings to enhance englacial layers and upper-layers scattering.
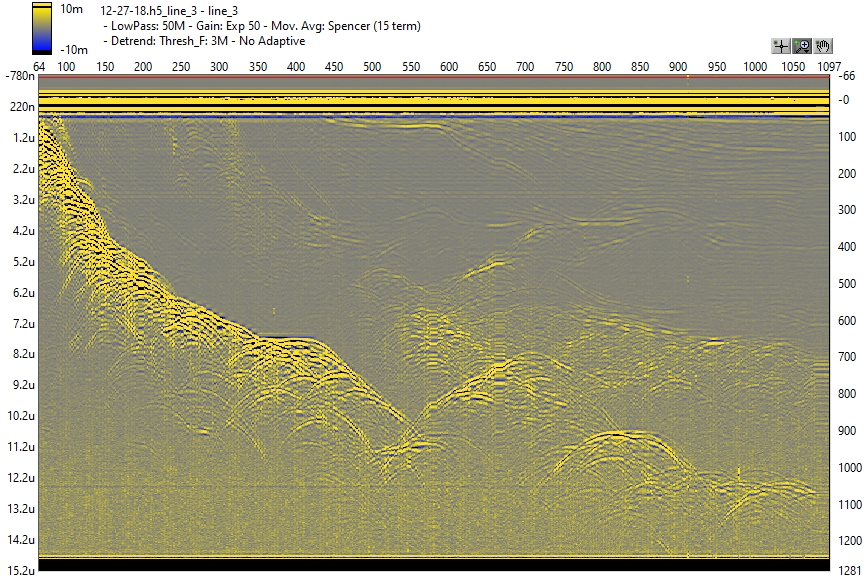
Mainland, Antarctica
Deep cold ice. Filtering for bed enhancement. 5 MHz center frequency. Credit: Climate Change Institute- UMaine
The same data set with filter settings enhancing englacial layers and folds.
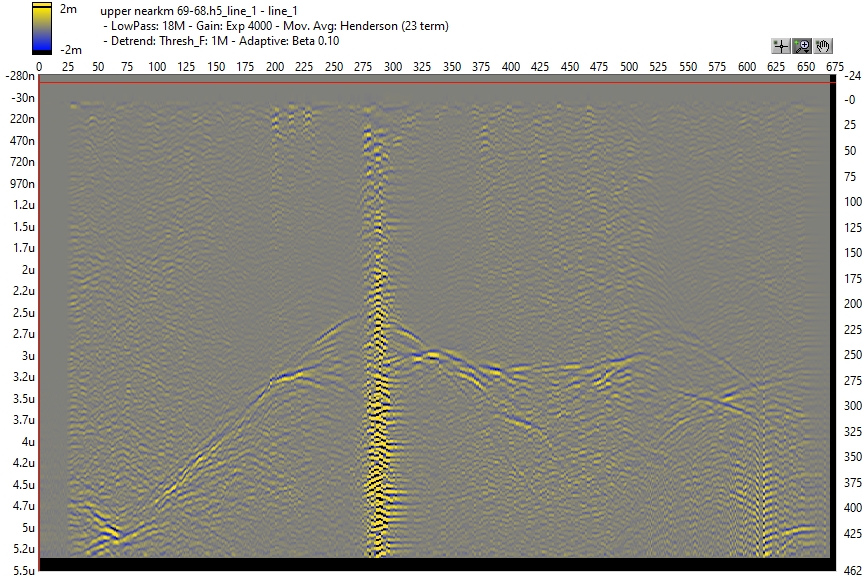
Axel Heiberg island, Canada
Cold ice. Intricate bed structure. 20MHz center frequency. Credit: SFU Glaciology Group and Queen's U. Glaciology.
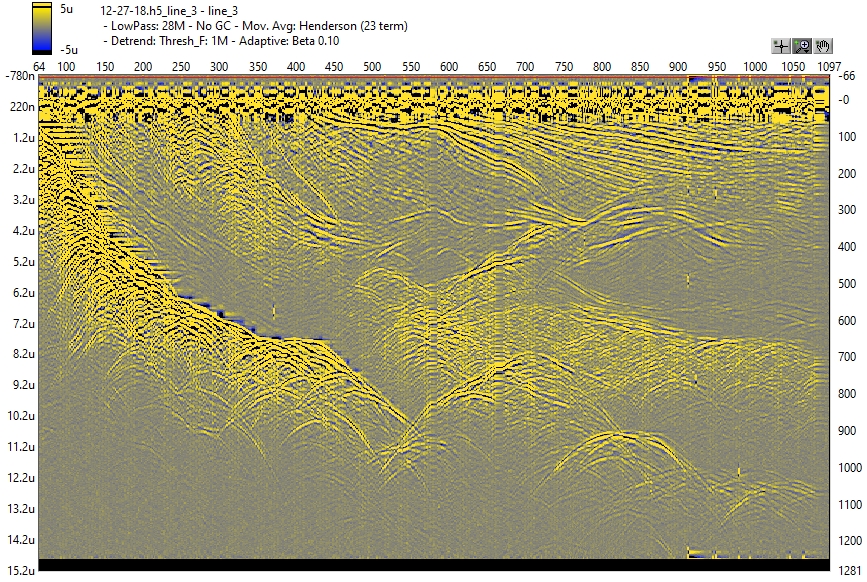
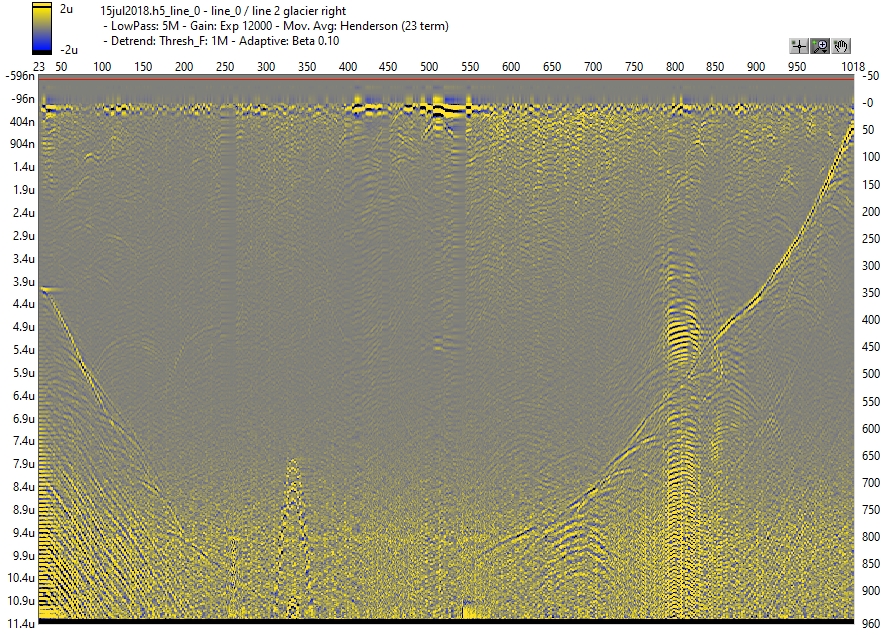
Yukon, Canada
Unprocessed radargram on Kaskawulsh GL. Polythermal ice assumed. 5 MHz center frequency. Credit: SFU Glaciology Group
Same radargram processed to remove upper englacial scattering and enhanced glacier bed.
Deeper cross-section and difficult bed to extract nearing 1000m depth.
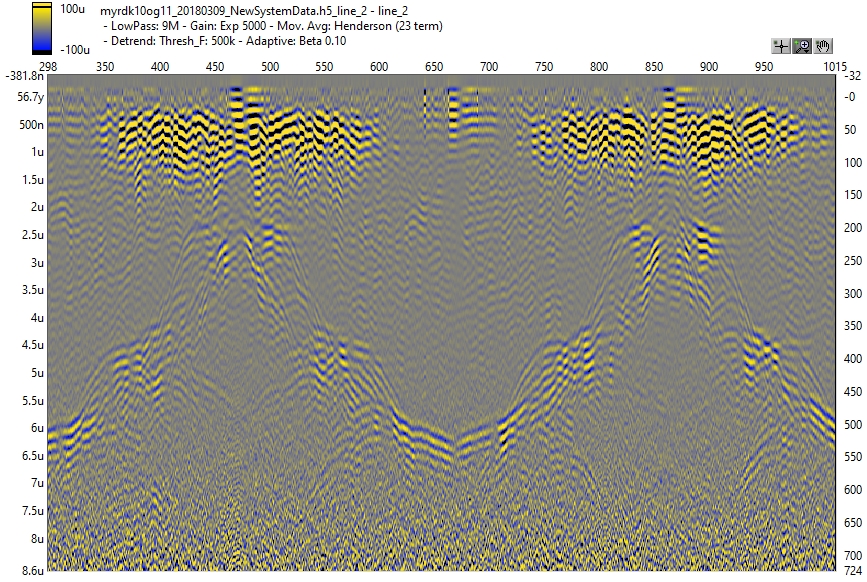
Katla volcano, Iceland
Temperate ice over cauldrons on Mýrdalsjökull, 2.5 MHz center frequency. Credit: Earth Science Institute, University of Iceland
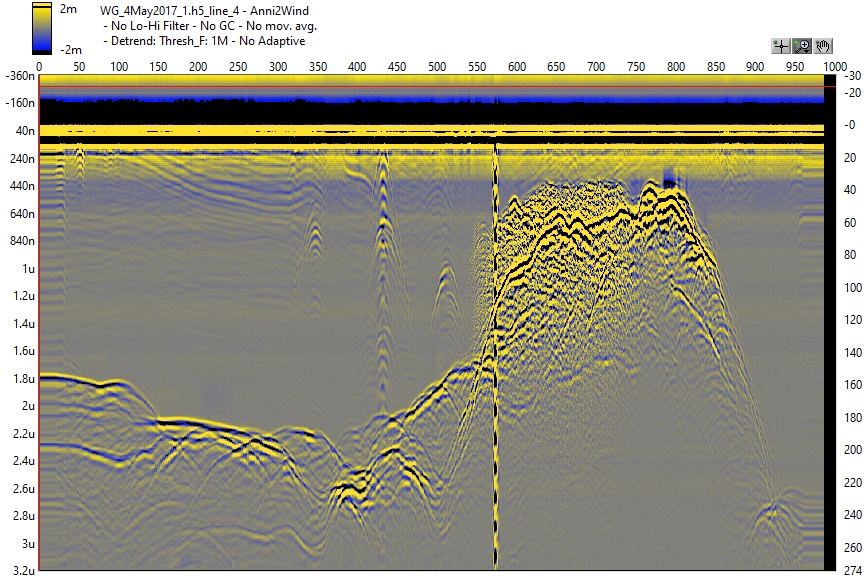
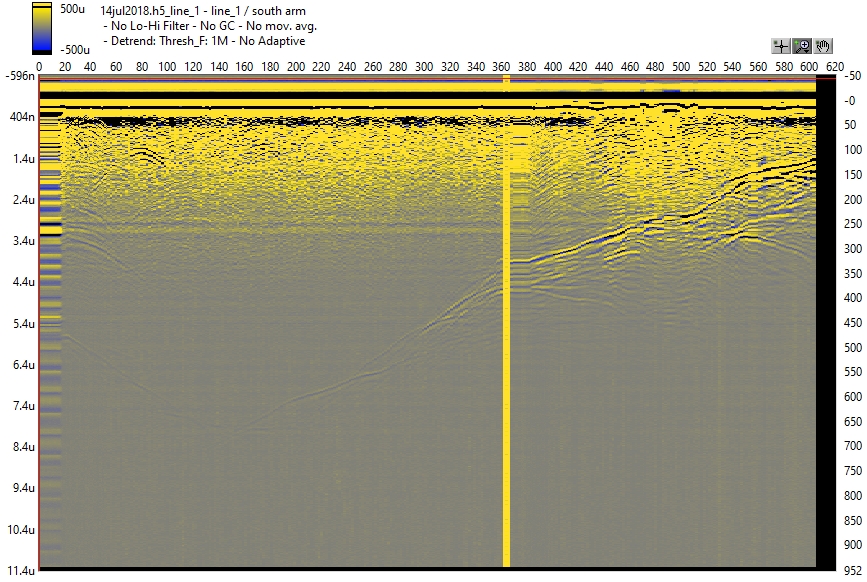
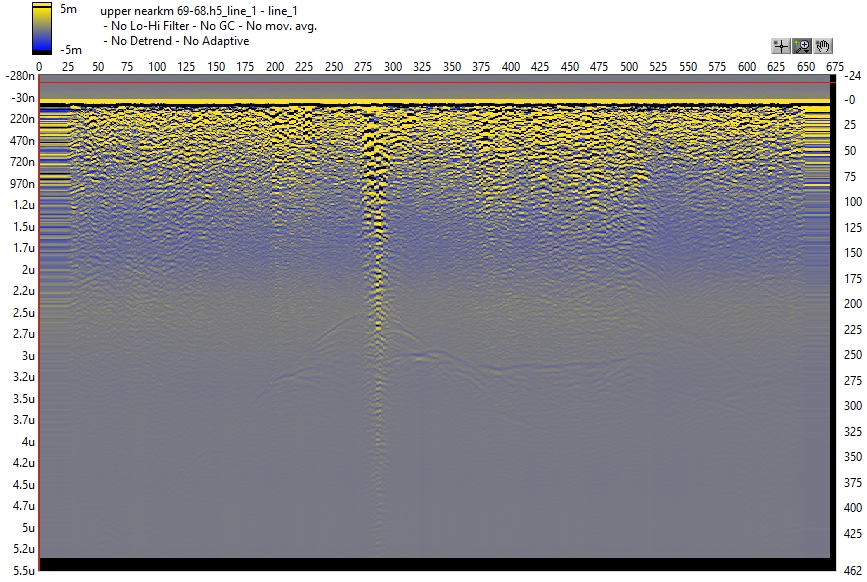
Coast Mountains, Canada
Temperate ice, 10 MHz center frequency. First example with no filtering showing strong attenuation and englacial scattering. Credit: BSI dataset.
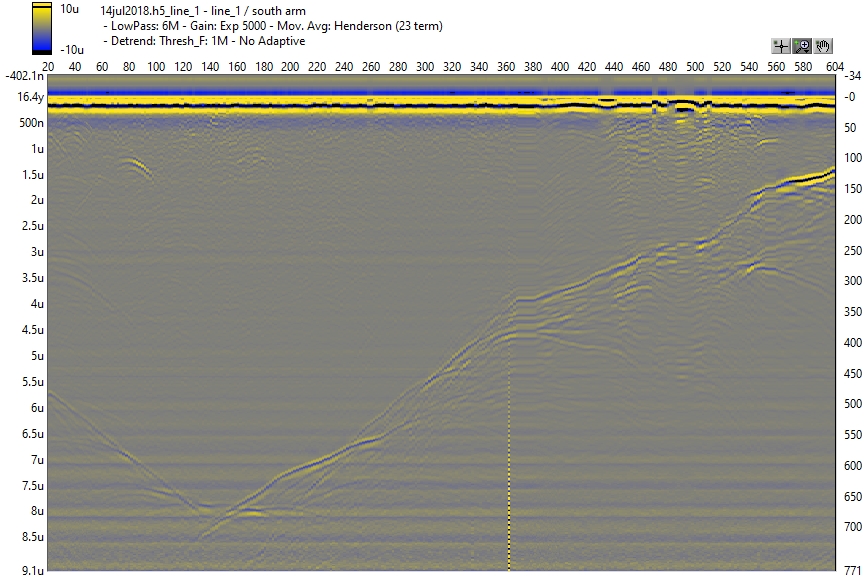
Same dataset with filter set to remove scattering and enhance bed.